

Vacancy/Net Absorption
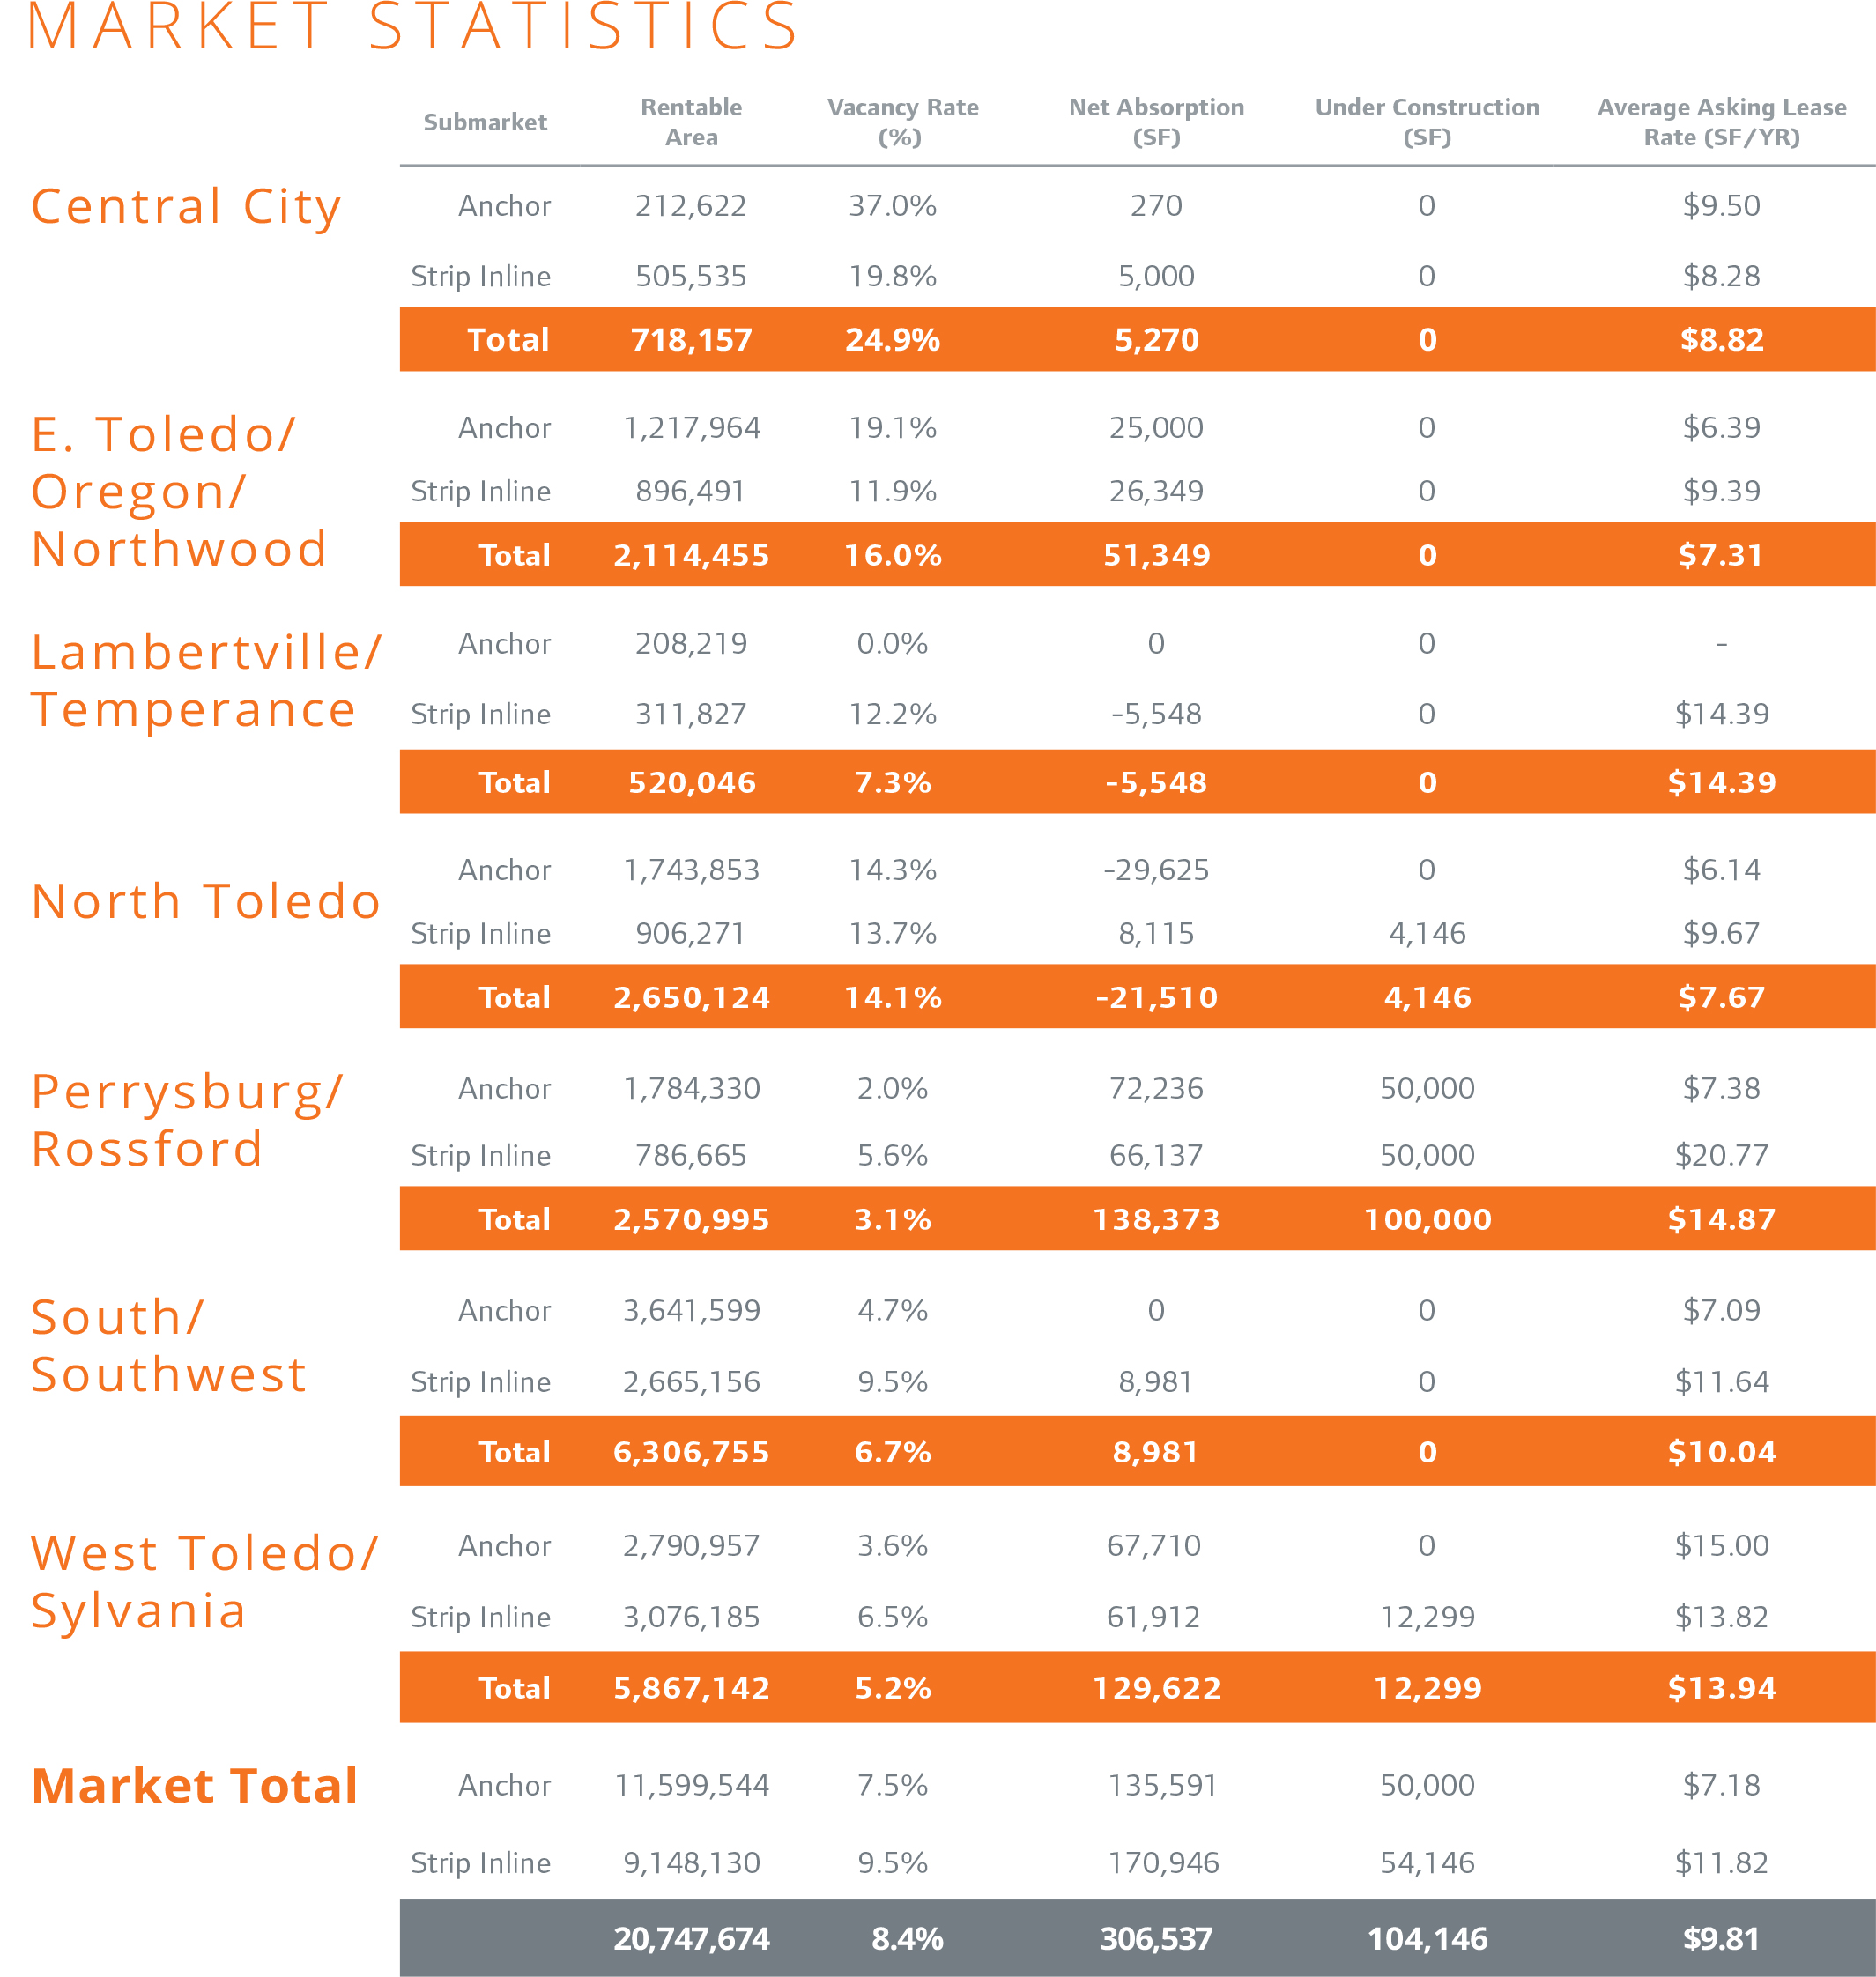
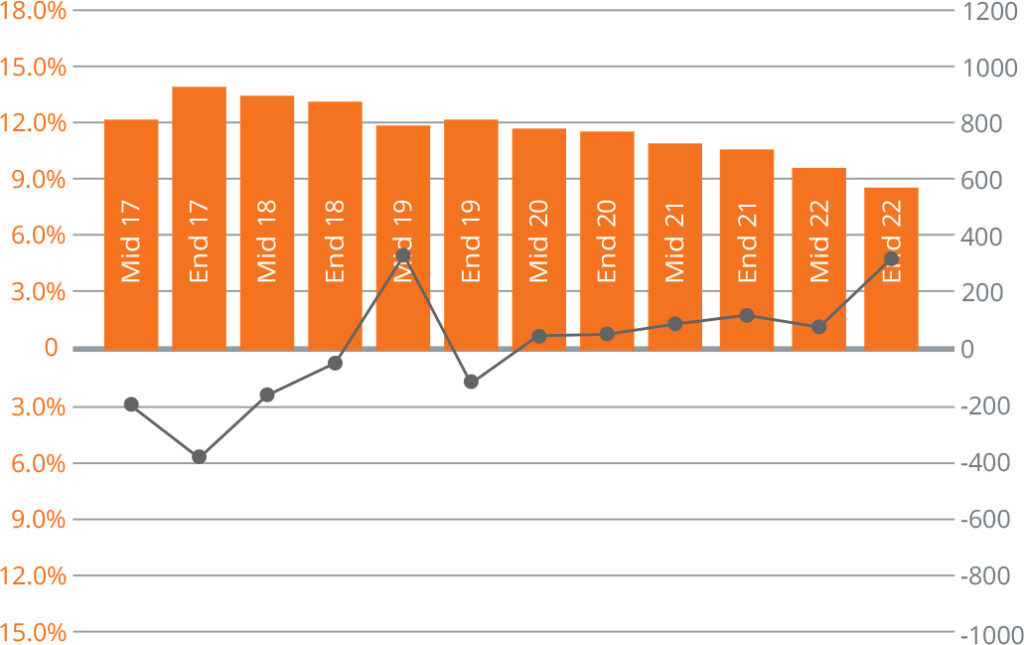
The overall market vacancy rate fell from mid-year 2022 and from the end of 2021 as vacancy declined both among the anchor and inline space segments. The outliers were the North Toledo and Lambertville/Temperance submarkets where vacancies increased. The overall market absorbed a total 343,109 square feet of space in 2022, 306,537 of that occurred in the second half of the year. The Perrysburg and West Toledo/Sylvania submarkets scored the biggest gains. Both the anchor and inline segments saw positive net absorption over the year.


Average Asking Lease Rate
The average asking rental rate for the overall market rose $.17 over 2022 to $9.81 per square foot. The average asking rental rate for anchor spaces fell $.51 per square foot to $7.18 and the rate for inline spaces rose $.43 to $11.82 over the same time period.


New Construction
There was 111,646 square feet in five projects under construction at the end of 2022 following delivery of two projects totaling 21,499 square feet in the second half of 2022. These mostly infill projects are scattered around the market, though Perrysburg continues to be the most active market. Construction activity seems poised to increase based on the number and scale of proposed projects in the pipeline.


For more information regarding the MarketView, please contact:
Harlan Reichle, CCIM, SIOR
President & CEO Reichle | Klein Group
One SeaGate, Toledo, OH 43604
419.794.1122 t 419.794.6060 f
hreichle@rkgcommercial.com
© Copyright 2021 Reichle | Klein Group. Information contained herein, including projections, has been obtained from sources believed to be reliable. While we do not doubt its accuracy, we have not verified it and make no guarantee, warranty or representation about it. It is your responsibility to confirm independently its accuracy and completeness. This information is presented exclusively for use by Reichle | Klein Group clients and professionals and all rights to the material are reserved and cannot be reproduced without prior written permission.
GLOSSARY OF TERMS
Average Asking Lease Rate: Rate determined by multiplying the asking net lease rate for each building by its available space, summing the products, then dividing by the sum of the available space with full-service gross leases for all buildings in the summary.
Net Leases: Includes all lease types whereby the tenant pays an agreed rent plus most, or all, of the operating expenses and taxes for the property, including utilities, insurance and/or maintenance expenses.
Market Coverage: Includes all competitive office buildings 5,000 square feet and greater in size.
Net Absorption: The change in occupied square feet from one period to the next.
Net Rentable Area: The gross building square footage minus the elevator core, flues, pipe shafts, vertical ducts, balconies and stairwell areas.
Occupied Area (Square Feet): Building area not considered vacant.
Under Construction: Buildings which have begun construction as evidenced by site excavation or foundation work.
Available Area (Square Feet): Available Building Area which is either physically vacant or occupied.
Availability Rate: Available Square Feet divided by the Net Rentable
Vacant Area (Square Feet): Existing Building Area which is physically vacant or immediately available.
Vacancy Rate: Vacant Building Feet divided by the Net Rentable Area.
Normalization: Due to a reclassification of the market, the base, number, and square footage of buildings of previous quarters have been adjusted to match the current base. Availability and Vacancy figures for those buildings have been adjusted in previous quarters.

